Visualizing Telemetry Data with Grafana
A few notes about the lab guide:
Output
This type of box is meant to describe output you will see if you run the commands given to you, useful if you are just reading the lab guide, or want to verify what you are seeing.
Info
This type of box is meant to represent file or config data
Overview
Collecting data for analyzing and troubleshooting has always been an important aspect in monitoring the health of a network. Cisco NX-OS provides several mechanisms such as SNMP, CLI, and Syslog to collect data from a network. These mechanisms have limitations that restrict automation and scale. One limitation is the use of the pull model, where the initial request for data from network elements originates from the client. The pull model does not scale when there is more than one network management station(NMS) in the network. With this model, the server sends data only when clients request it. To initiate such requests, continual manual intervention is required. This continual manual intervention makes the pull model inefficient. A push model continuously streams data out of the network and notifies the client. Telemetry enables the push model, which provides near-real-time access to monitoring data.
Devices can many different types of data as telemetry, metrics, status, etc. In this lab we will be graphing metrics over time using Grafana.
We will review the components needed to collect this pushed data using an open-source stack.
In this lab we will be leveraging some pre-built components but you can dig into them further by expending the "info" boxes.
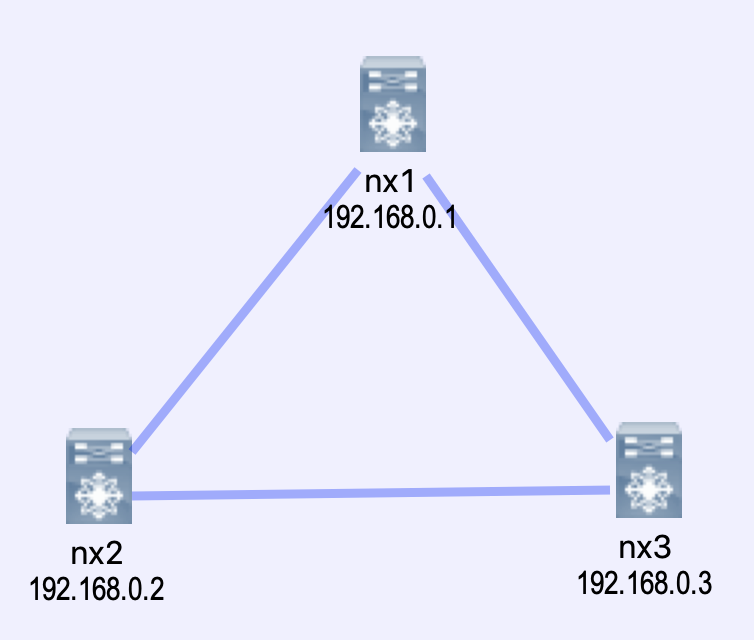
Topology
We will be using virlfiles/3nx as the topology for this lab. Overall the topology isn't too important in this exercise. We just need an OS that supports telemetry (NXOSv) and we will leverage Devbox inside the DevnetSandbox to host our telemetry stack.
The Telemetry Stack
In our use case we are wanting to visualize data using graphs over time. We chose Grafana to build the graphs.
InfluxDB was our chosen tool to store data. As a time series database it makes it very easy to write time based queries.
Pipeline is our telemetry receiver. It is responsible for receiving data, parsing it, and transforming it into a format we can store inside of InfluxDB
We have used docker-compose to make this stack easy to deploy in a predictable manor.
Pre-reqs
You must have the Cisco Devnet sbx_multi_ios sandbox checked out and gone through the sanbox setup
If you are doing this lab at an event (DevNet, Cisco Live, VT, etc) this step may have been completed for you. Check with your proctor for access instructions.
Lab Setup
All steps presnted in this guide are written to be completed from the devbox
-
ssh to devbox
ssh developer@10.10.20.20(password C1sco12345) -
Clone the required code and change into the correct directory
git clone https://github.com/DevNetSandbox/sbx_multi_ios
cd sbx_multi_ios/metrics-grafana
-
Launch the lab environment
This may take some time as we are launching a VIRL simulation
make lab
This step may take a few minutes while we get things setup. You can take a look at the Makefile to see what we are doing to setup the environment.
You should see output similar to the following:
TODO
Add 'make lab' output
Output
At this point we have a running VIRL simulation, a full containerized telemetry stack, and we are ready to get started.
Looking under the covers
If you want to see what we have going on behind the scenes in the lab run 'virl nodes' and 'make stackstatus'
virl nodes
[developer@devbox metrics-pig-nx]$virl nodes
Here is a list of all the running nodes
╒════════╤═════════════╤═════════╤═════════════╤════════════╤══════════════════════╤════════════════════╕
│ Node   │ Type        │ State   │ Reachable   │ Protocol   │ Management Address   │ External Address   │
╞════════╪═════════════╪═════════╪═════════════╪════════════╪══════════════════════╪════════════════════╡
│ nx1    │ NX-OSv 9000 │ ACTIVE  │ REACHABLE   │ telnet     │ 172.16.30.65         │ N/A                │
├────────┼─────────────┼─────────┼─────────────┼────────────┼──────────────────────┼────────────────────┤
│ nx2    │ NX-OSv 9000 │ ACTIVE  │ REACHABLE   │ telnet     │ 172.16.30.66         │ N/A                │
├────────┼─────────────┼─────────┼─────────────┼────────────┼──────────────────────┼────────────────────┤
│ nx3    │ NX-OSv 9000 │ ACTIVE  │ REACHABLE   │ telnet     │ 172.16.30.67         │ N/A                │
╘════════╧═════════════╧═════════╧═════════════╧════════════╧══════════════════════╧════════════════════╛
make stack-status
[developer@devbox telemetry-stack]$docker-compose ps
              Name                             Command               State                       Ports
---------------------------------------------------------------------------------------------------------------------------
telemetrystack_elasticsearch_1      /usr/local/bin/docker-entr ...   Up      0.0.0.0:9200->9200/tcp, 0.0.0.0:9300->9300/tcp
telemetrystack_grafana_1            /run.sh                          Up      0.0.0.0:3000->3000/tcp
telemetrystack_influxdb_1           /entrypoint.sh influxd           Up      0.0.0.0:8083->8083/tcp, 0.0.0.0:8086->8086/tcp
telemetrystack_prometheus_1         /bin/prometheus -config.fi ...   Up      0.0.0.0:9090->9090/tcp
telemetrystack_unified-pipeline_1   /bin/sh -c ./startup.sh          Up      0.0.0.0:57500->57500/tcp
Telemetry Components Overview
There are four major components of telemetry we need to outline before we get started.
Data Collection
Telemetry data is collected from a few possible sources:
- Data Management Engine (DME) - This data can be collected periodically or only when a change is made to the specified path
- NX-API - This data can be collected periodically
- YANG
We will only be exploring NX-API and DME in this lab
Data Encoding
The telemetry encoder encapsulates the collected data into the desired format. For NXOS we have the following options:
- Google Protocol Buffers (GPB) - Protocol buffers are Google's language-neutral, platform-neutral, extensible mechanism for serializing structured data – think XML, but smaller, faster, and simpler. You define how you want your data to be structured once, then you can use special generated source code to easily write and read your structured data to and from a variety of data streams and using a variety of languages.
- JSON - (JavaScript Object Notation) is a lightweight data-interchange format. It is easy for humans to read and write. It is easy for machines to parse and generate
Why use one vs. another?
JSON is easy to read, maintain and change. GPB is lightweight and faster to process.
In this lab it doesn't matter much. However at this point in time with telemetry you will be deciding based upon the capabilities of the device sending telemetry, and the capabilities of the telemetry receiver.
Assuming you can choose between both, at scale GPB is likely where you want to lean. Less bits on the wire.
Data Transport
NXOS supports the following Data Transports with the following encodings:
| Transport | Encoding |
|---|---|
| HTTP | JSON |
| gRPC | GPB |
| UDP | JSON, GPB |
Telemetry Receiver
The telemetry receiver is a remote system that ingests and stores the telemetry data.
In our lab we will be leveraging Pipeline as the telemetry reciever. Pipeline will store its data as metrics in InfluxDB.
Nexus Telemetry Setup
To begin we need to setup telemetry collection on our Nexus devices.
We have created sample configuration to get you started that is already setup for parsing my our telemetry receiver (Pipeline).
The data parsing can be tedious and requires rebuilds of the Pipeline container, so it will not be addressed in this lab
In our example we have setup 2 sensor groups and 1 destination group:
- destination-group 100 - This group points to Devbox port 57500 where our telemetry receiver is listening. We are transporting data encoded in GPB over gRPC
- sensor-group 100 - This group uses the DME
- sensor-group 200 - This group uses NX-API
- subscription 200 - This binds the sensor group and destination group together. In this example we are sampling every 20 seconds, just so we don't crush our devbox. We can easily overwhelm a telemetry receiver with data.
Copy the content of sample-nxos-config.txt and apply it to nx1, nx2, and nx3. We will use virlutils to ssh into the devices.
You can find the NXOS config in sample-nxos-config.txt
sample-nxos-config.txt
feature nxapi
feature telemetry

telemetry
  destination-profile
    use-vrf management
  destination-group 100
    ip address 10.10.20.20 port 57500 protocol gRPC encoding GPB
  sensor-group 200
    data-source NX-API
    path "show ip route summary"
    path "show system resources"
    path "show interface mgmt0"
  subscription 200
    dst-grp 100
    snsr-grp 200 sample-interval 20000
| Credentials | |
|---|---|
| username | admin |
| password | cisco |
cp sample-nxos-config.txt
virl ssh nx1
Explore some show telemetry commands. You should see if we are successfully sending telemetry data.
Pipeline Overview
Pipeline is an open source telemetry receiver for IOS XR and NXOS.
Pipeline supports many different input transports including:
- TCP
- gRPC
- UDP
- Apache Kafka
It also supports the following encoding:
- st
- GPB, both Compact and K/V
- JSON
From an output perspective Pipeline supports Apache Kafka, gRPC, but most importantly in our stack Metrics Extraction. This allows us to connect pipeline to a Time Series Database (TSDB), in this case InfluxDB. We can then layer on other visualization tools to view the data, like Grafana.
The 3 main components of Pipeline are:
pipeline.bin- Pipeline's binarypipeline.conf- inbound and outbound config for pipeline. The key components within the file are[gRPCDialout]and[influxdb]. The[inspector]is a tap that allows us to dump the inbound telemetry data to a file to allow us to see what is being sent, so we can setup our parser in themetrics.jsonfile.
pipeline.conf
[default]

id = unified-pipeline


[gRPCDialout]
stage = xport_input
type = grpc
encap = gpb
listen = :57500

datachanneldepth = 1000

[inspector]
stage=xport_output
type=tap
file=telemetry_model_raw.txt


[influxdb]
stage = xport_output
type = metrics
file = /etc/pipeline/metrics_gpb.json
dump = metricsdump.txt
username=cisco
password=VXJIodGD1ABLKJYg1Xcsdj6goVgezhtVX44zIO9ha1pPOK09WyfeTq+7HdJ8gKdgxPcXxsbuiZsQ0JYJ8KFcMHPdjy/V5F76Wc9qwm7f6+NeFca7XaiTIr1t4rwOG5cHDWooPW023v2cpiLIjQjpoeam/xyBJTKFuyPvi3/CgokXn5Hx3GCZqx1UDdikcSrh8xh3yXVkNzzSk8g2RwiBTdrlbrFEWBe1rW8SF4hapWvjZ22asvxOLF6YB6i2XUyggnHF4+oB4DLY7mqlfWUU2gibqMqCfsmZBwCnRww2+4Y1r1qZyAstd4a2orSDCtPN7sw6HyeAd6tKIj1F9UOwQWgDBnkQBGAH1Gdq9iCTF6Q/gMgN5F+g4FU9dGXQYcUw0BmlNYtRiR74ecAgDLdZ5mijIuJmaFyEdo+bIuHdXSIhc875TjoP23AnpbSA95tWsuwc7gtB0Sx165NDZwJWOOPVlNUQ4XV/PcOF+atO7GVnvfC1jcd+Ds2W9pPVWIlIbboWIjSp+vGww9lB8AWIbqFxxoM7NRJJyfzqNLJemW7De7EmuBU5rFRvYIjZi1+5x+jpERFi5Hry+YtrDWmpXBjqVi6K0InSXMk7NMVC8JByZF7V8CmheH/lIx9w9mwHnYWpwsqvPl1HTcjr4R4kuGPio5RGk88QuovjsgwIRD0=
output = influx
influx = http://influxdb:8086
database = netdevops
metrics.json- parser for the telemetry data
metrics.json
[
    {
        "basepath": "Cisco-NX-OS-device:System/ospf-items/operSt",
        "spec": {
            "fields": [
                {"name": "Cisco-NX-OS-device:System/ospf-items/operSt", "tag": true},
                {
                    "name": "",
                  "fields":
                        [
                            {"name": "operSt"}
                        ]
                }
            ]
        }
    },
    {
        "basepath": "show system resources",
        "spec": {
            "fields": [
                {"name": "show system resources", "tag": true},
                {
                    "name": "",
                    "fields":
                        [
                            {"name": "cpu_state_user"},
                            {"name": "cpu_state_kernel"},
                            {"name": "cpu_state_idle"},
                            {"name": "memory_usage_free"},
                            {"name": "memory_usage_total"},
                            {"name": "memory_usage_total"}
                        ]
                }
            ]
        }
    },
  ...
  ...
  ...
  ]
Lets take a look at an NX-API parsing example: show system resources.
First tail our tap file to see if we can find data from show system resources.
make tap
This is the raw data that is coming into pipeline from our Nexus switches.
Let's look for one from show system resources. If you don't find one you can use the example below.
show system resources telemetry
------- 2019-05-09 20:17:51.031108675 +0000 UTC m=+175.717736295 -------
Summary: GPB(common) Message [172.16.30.65:23370(nx1)/show system resources msg len: 575]
{
    "Source": "172.16.30.65:23370",
    "Telemetry": {
        "node_id_str": "nx1",
        "subscription_id_str": "200",
        "encoding_path": "show system resources",
        "collection_id": 1012,
        "collection_start_time": 0,
        "msg_timestamp": 1557433070928,
        "collection_end_time": 0
    },
    "Rows": [
        {
            "Timestamp": 0,
            "Keys": {
                "show system resources": "show system resources"
            },
            "Content": {
                "": {
                    "TABLE_cpu_usage": {
                        "": {
                            "ROW_cpu_usage": {
                                "_PIPELINE_EDIT": [
                                    {
                                        "cpuid": 0,
                                        "idle": "71.13",
                                        "kernel": "13.40",
                                        "user": "15.46"
                                    },
                                    {
                                        "cpuid": 1,
                                        "idle": "83.51",
                                        "kernel": "16.48",
                                        "user": "0.00"
                                    }
                                ]
                            }
                        }
                    },
                    "cpu_state_idle": "77.12",
                    "cpu_state_kernel": "14.89",
                    "cpu_state_user": "7.97",
                    "current_memory_status": "OK",
                    "load_avg_15min": "0.62",
                    "load_avg_1min": "0.75",
                    "load_avg_5min": "0.64",
                    "memory_usage_free": 1552392,
                    "memory_usage_total": 6066740,
                    "memory_usage_used": 4514348,
                    "processes_running": 1,
                    "processes_total": 689
                }
            }
        }
    ]
}
We can build our metrics.json file to parse this data to collect the fields we are interested in. In this case we are looking for:
| field |
|---|
| cpu_state_user |
| cpu_state_kernel |
| cpu_state_idle |
| memory_usage_free |
| memory_usage_total |
| memory_usage_used |
example parser
{
  "basepath": "show system resources",
  "spec": {
    "fields": [
      {"name": "show system resources", "tag": true},
      {
        "name": "",
        "fields":
          [
            {"name": "cpu_state_user"},
            {"name": "cpu_state_kernel"},
            {"name": "cpu_state_idle"},
            {"name": "memory_usage_free"},
            {"name": "memory_usage_total"},
            {"name": "memory_usage_total"}
          ]
      }
    ]
  }
},
You can see how we called out the fields we care out. These will be sent to InfluxDB.
InfluxDB
InfluxDB is an open source Time Series DB (TSDB) that we will be leveraging to store the telemetry data we are sending to Pipeline. A TSDB is optimized around handling arrays of numbers indexed by time. This makes it a perfect companion to Grafana.
While we don't need to be InfluxDB experts to leverage it, its good to know how to check and validate your data is there.
Influx does have a web interface that you can reach at http://10.10.20.20:8083 but we'll just be using CURL for these examples.
First lets make sure our database got created. We are looking for one called netdevops
curl http://10.10.20.20:8086/query?q=SHOW+DATABASES
Output
[developer@devbox telemetry-stack]$curl http://10.10.20.20:8086/query?q=SHOW+DATABASES
{"results":[{"series":[{"name":"databases","columns":["name"],"values":[["netdevops"],["_internal"]]}]}]}
Hopefully you see the database netdevops in the output. That confirms InfluxDB is setup as we need it, now lets see if we are recieving data from the switches:
curl -G 'http://localhost:8086/query?pretty=true' --data-urlencode "db=netdevops" --data-urlencode "q=SHOW MEASUREMENTS"
Output
[developer@devbox telemetry-stack]$curl -G 'http://localhost:8086/query?pretty=true' --data-urlencode "db=netdevops" --data-urlencode "q=SHOW MEASUREMENTS"
{
    "results": [
        {
            "series": [
                {
                    "name": "measurements",
                    "columns": [
                        "name"
                    ],
                    "values": [
                        [
                            "show system resources"
                        ]
                    ]
                }
            ]
        }
    ]
}
At this point we can see we have measurements inside our database. If you are interested in digging into them you can find the API guide for InfluxDB here.
Grafana
Grafana is an open source general purpose dashboard and graph composer. We can leverage it to graph the telemetry data we are storing in Grafana.
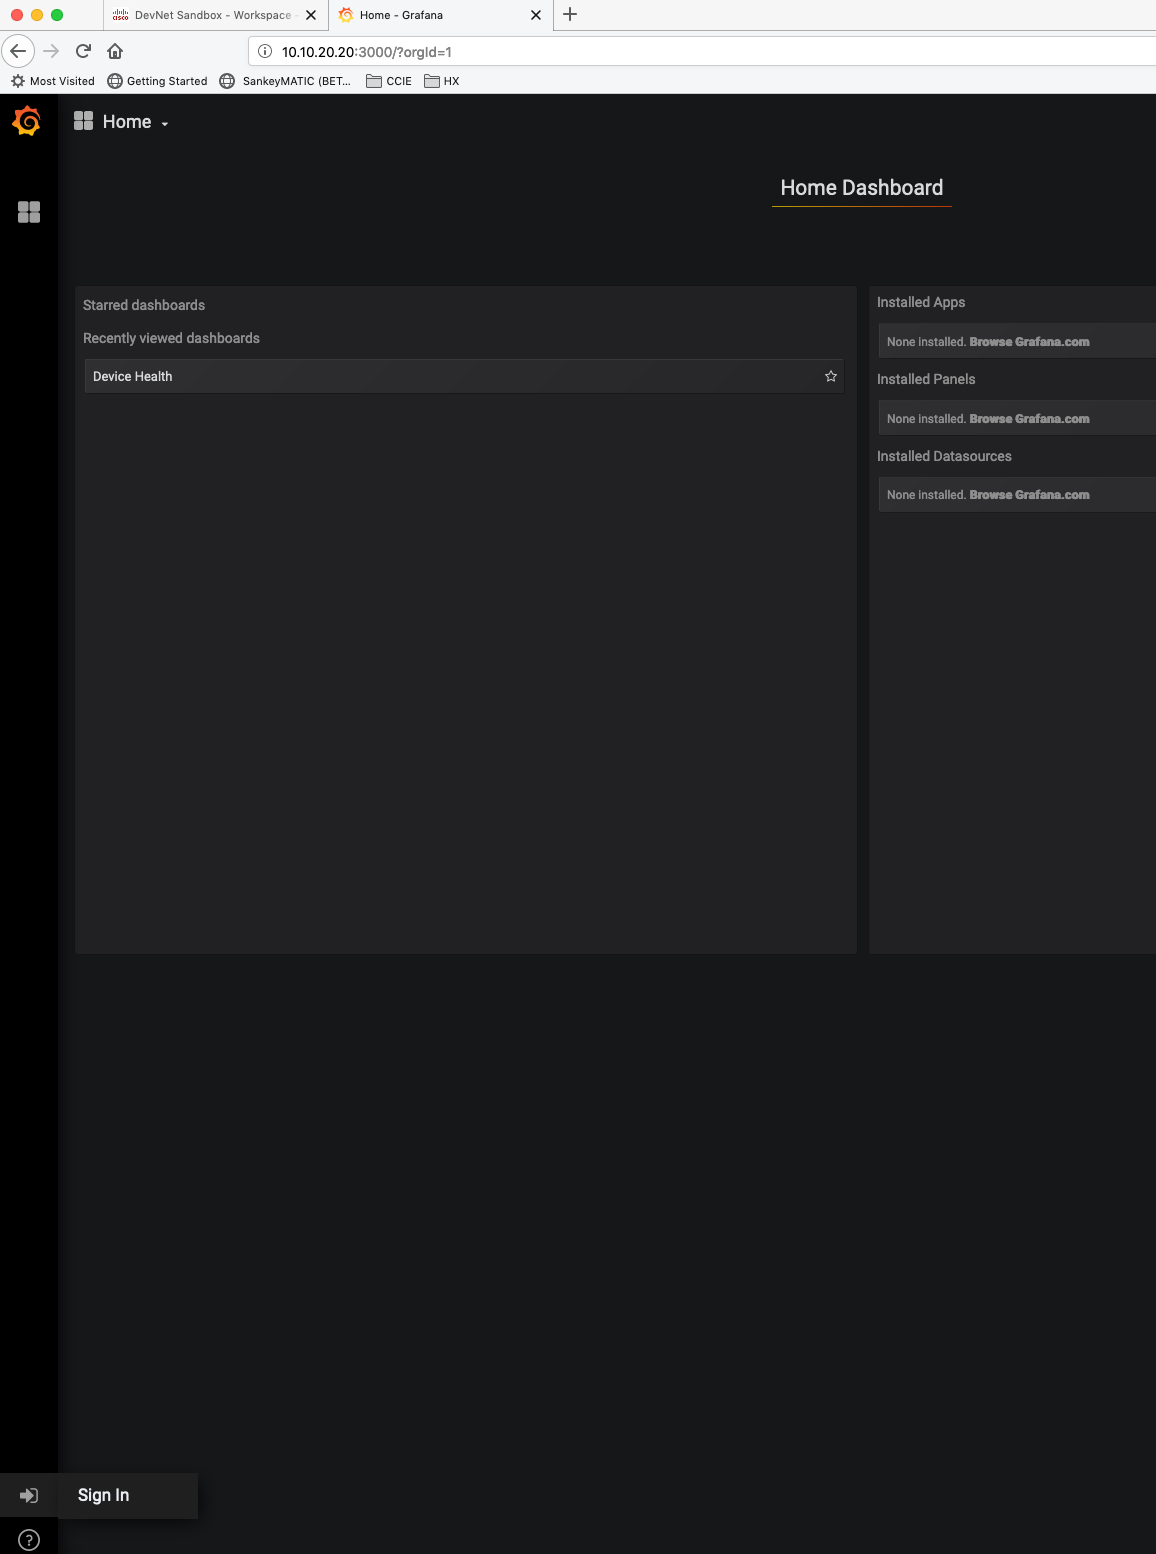
Access Grafana by pointing your browser to http://10.10.20.20:3000.
Setup
We first need to setup Grafana to read data from InfluxDB. Log into Grafana using the username: admin and password: admin. You can find the login icon at the bottom left of the screen.
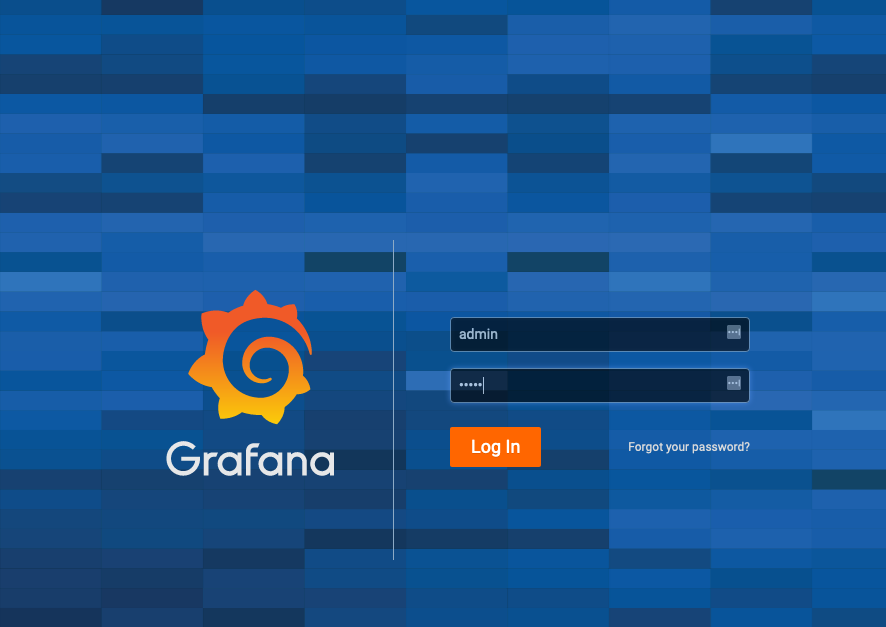
Note
Grafana may ask you to change the admin password, you can safely skip this step.
After you login, you will be broght to your Home Dashboard. Click Create your first data source
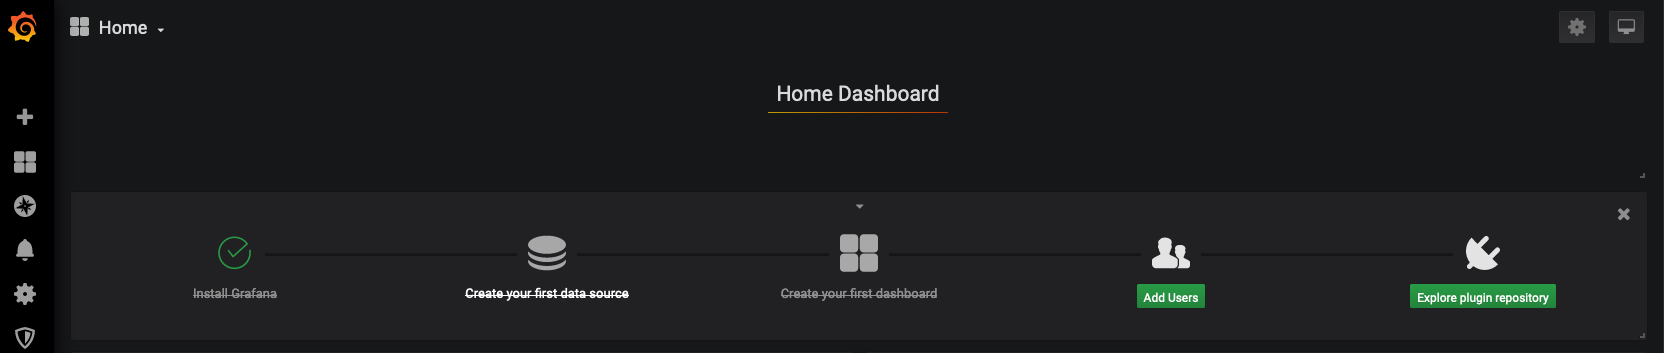
Select InfluxDB
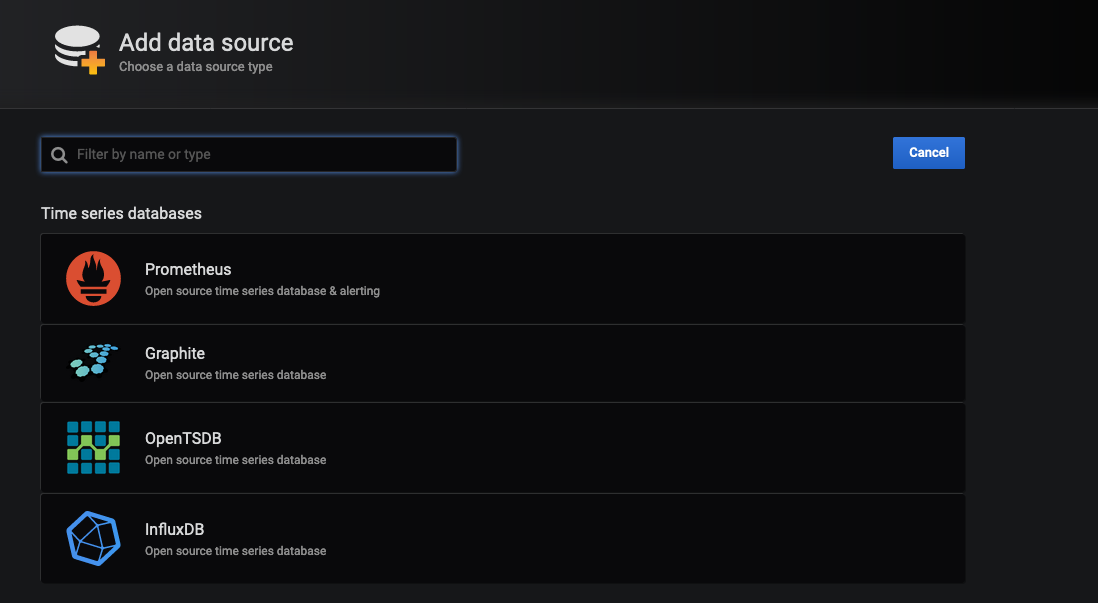
Set the following:
| field | value |
|---|---|
| URL | http://influx:8086 |
| Database | netdevops |
| User | cisco |
| Password | cisco |
Once you fill out the fields click the test button at the bottom.
Now that we have connected Grafana to InfluxDB we can begin to visualize the data.
Build our First Dashboard
CPU Utilization
Let's build a dashboard. Click Create your first Dashboard
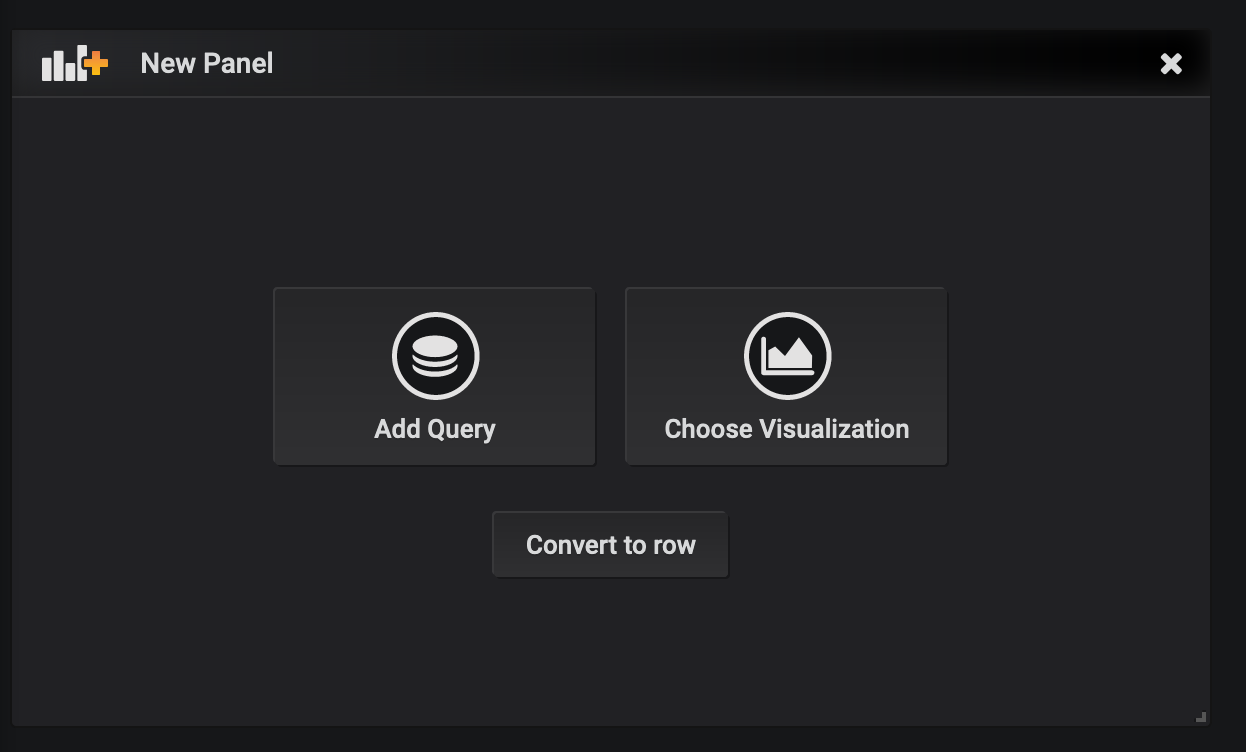
Click Add Query
Here we can see a live graph that will map the data we are going to query over time.
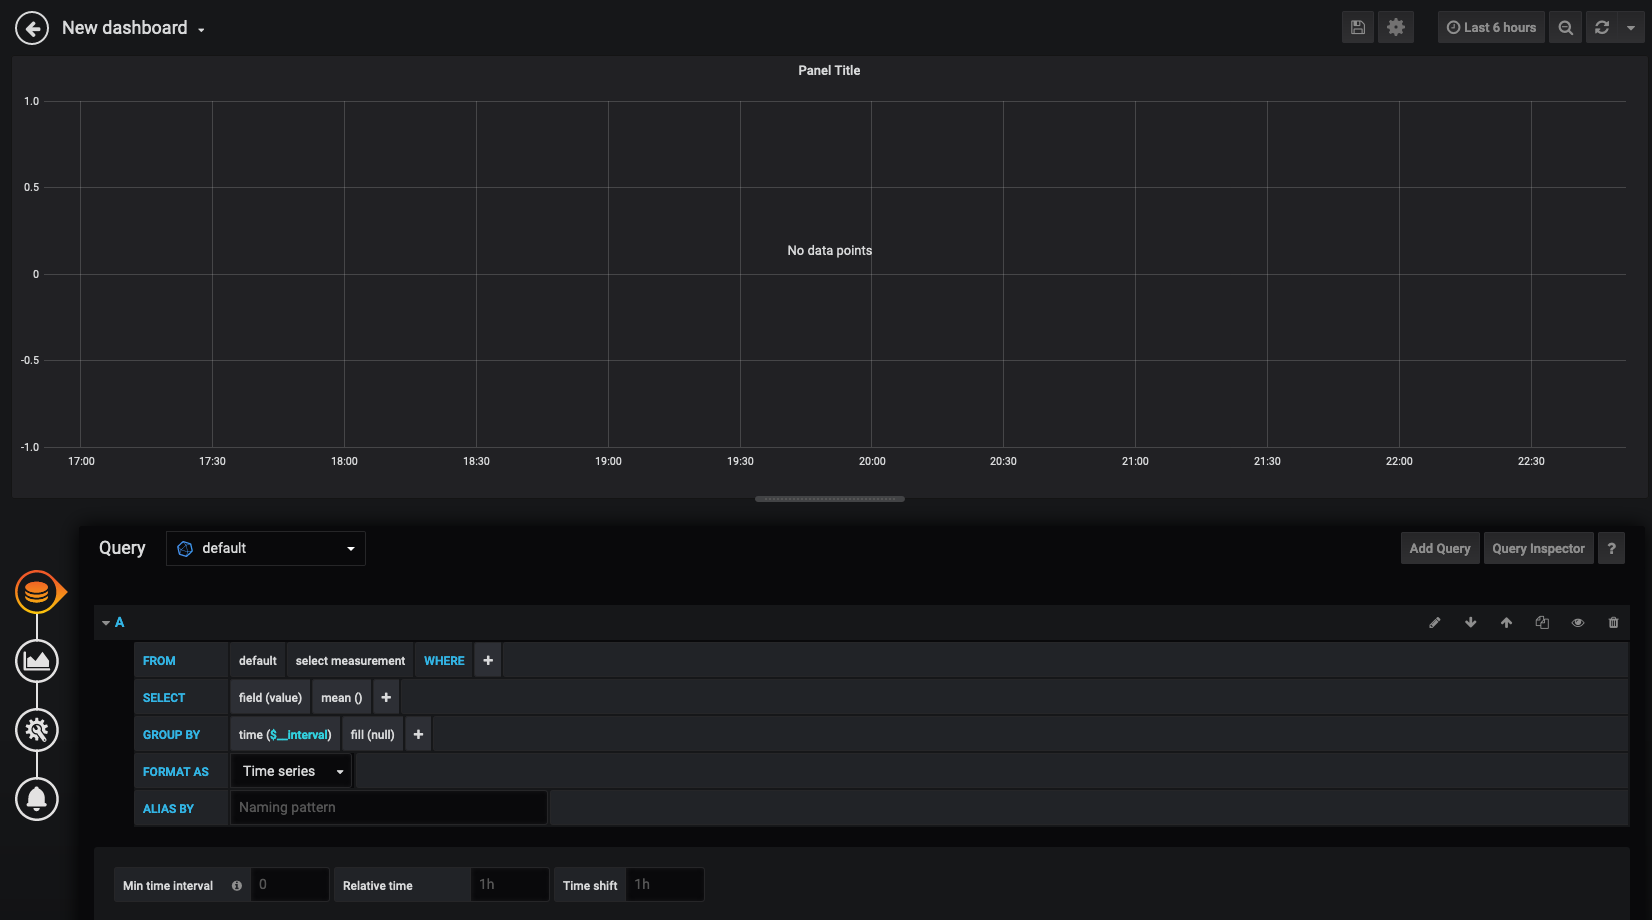
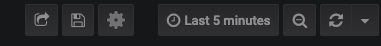
You will also want to change how far back we are looking into the database. Let's change that range to 5 minutes. You can do this in the top right corner of the screen:
We will map out nx1 user and kernel CPU utilization. We'll be adding two queries. If you are familiar with SQL you will see similarities here.
Queries
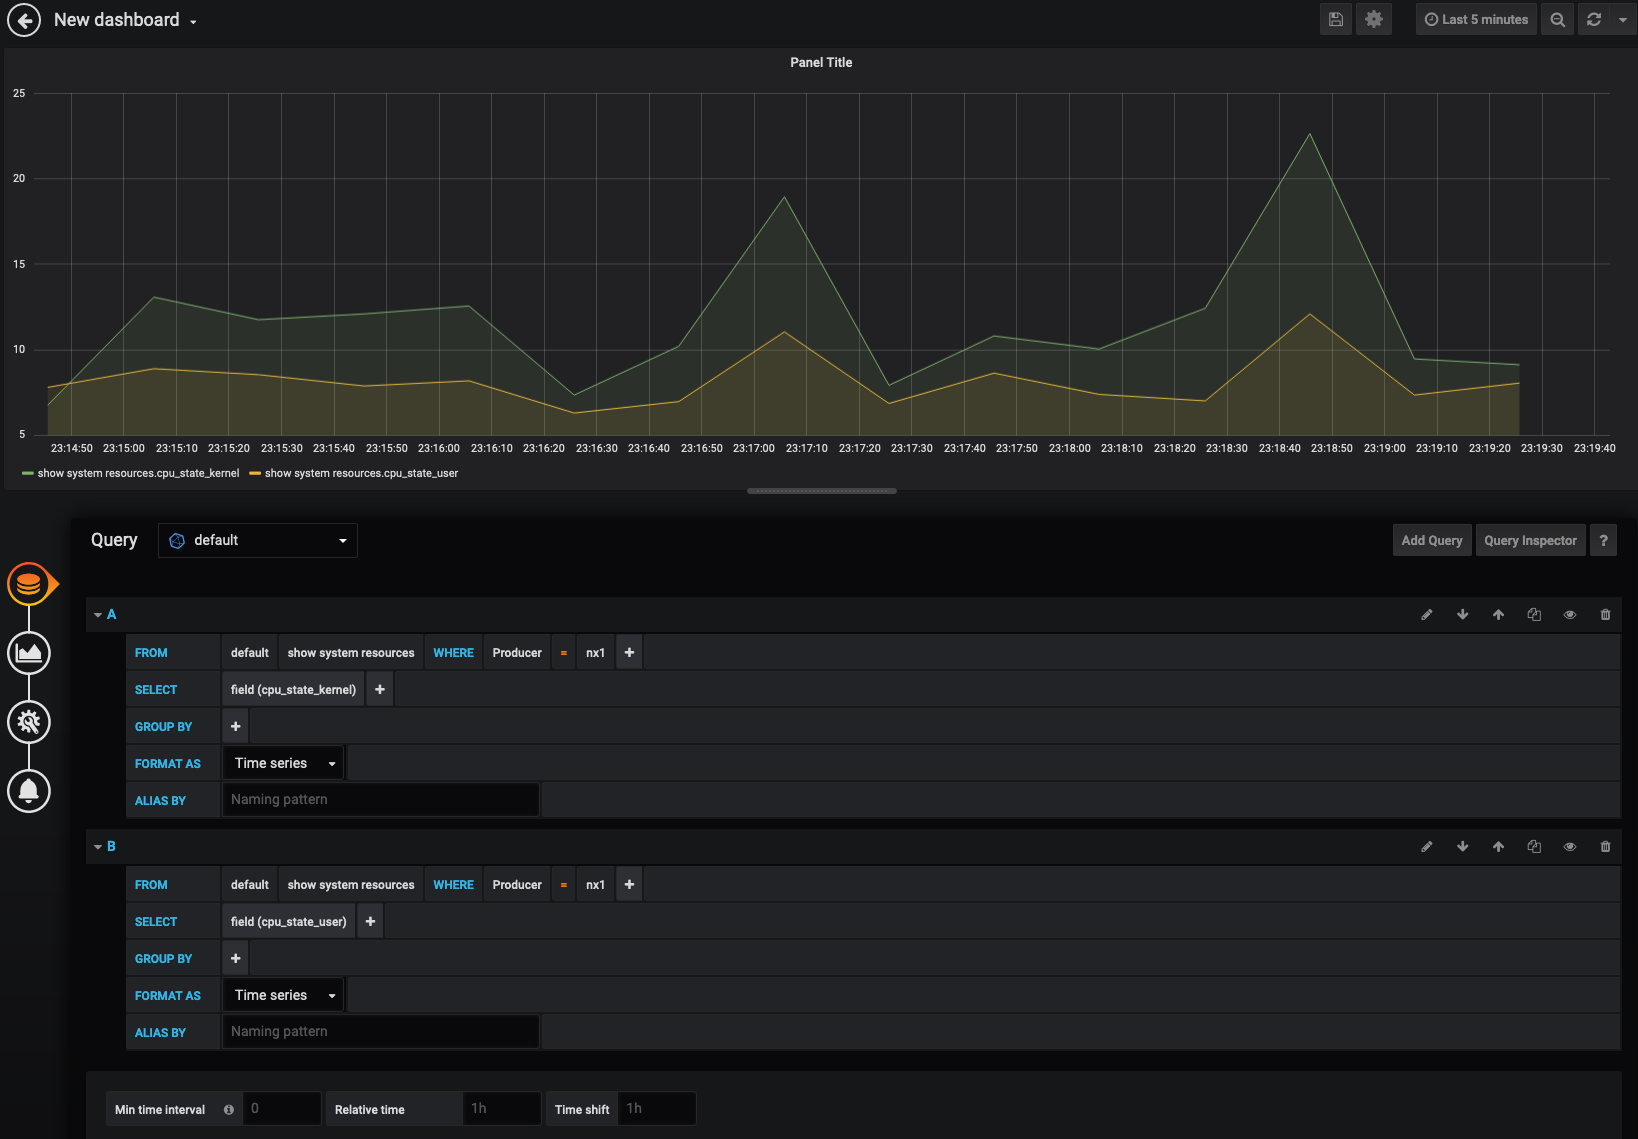
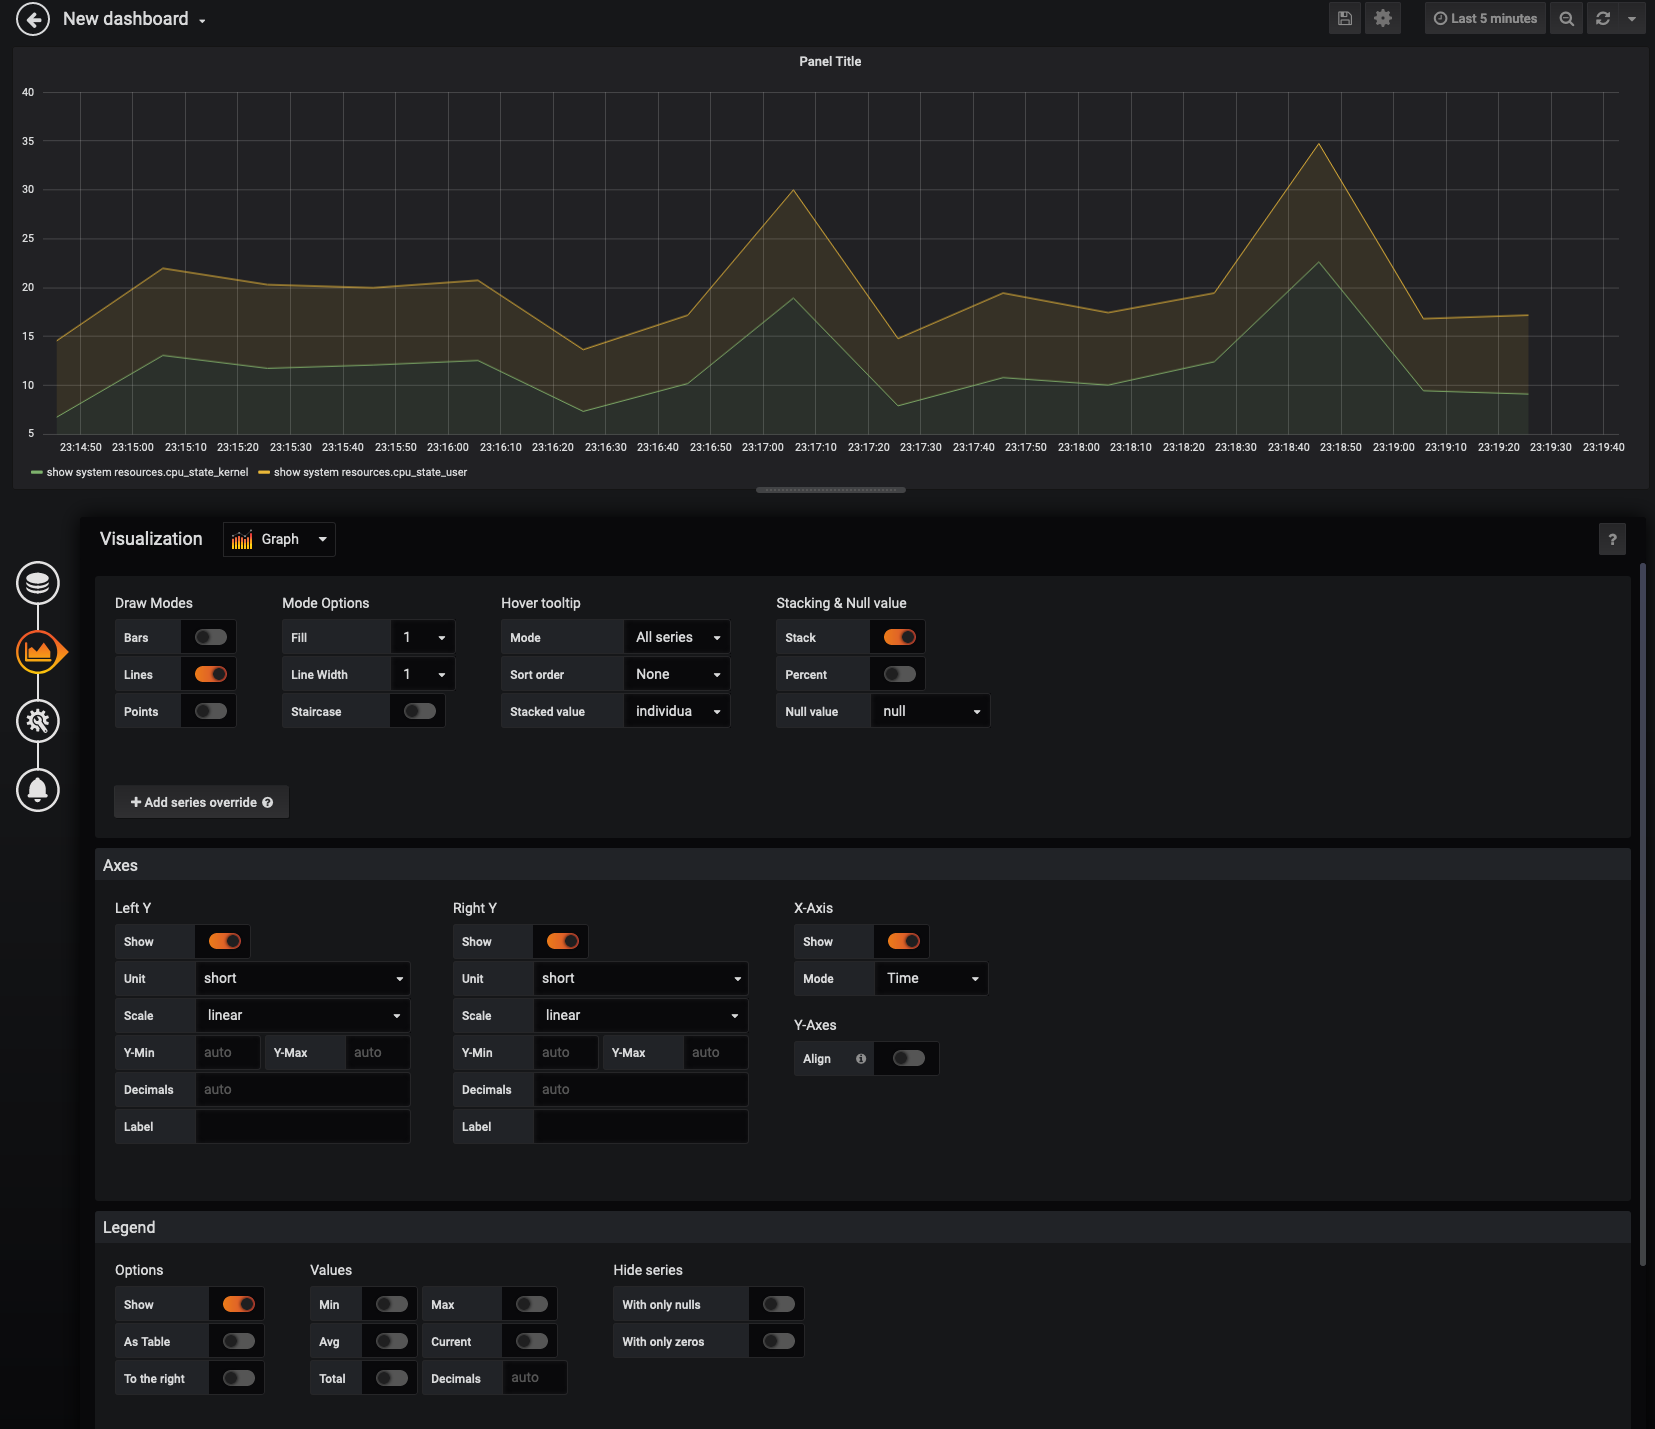
As you see they overlay each other, but what we are really looking for is mapping out totaly cpu utilization. Click on the 2nd icon on the left to adjust the visualization.
Here we want to enable data stacking
Data Stacking
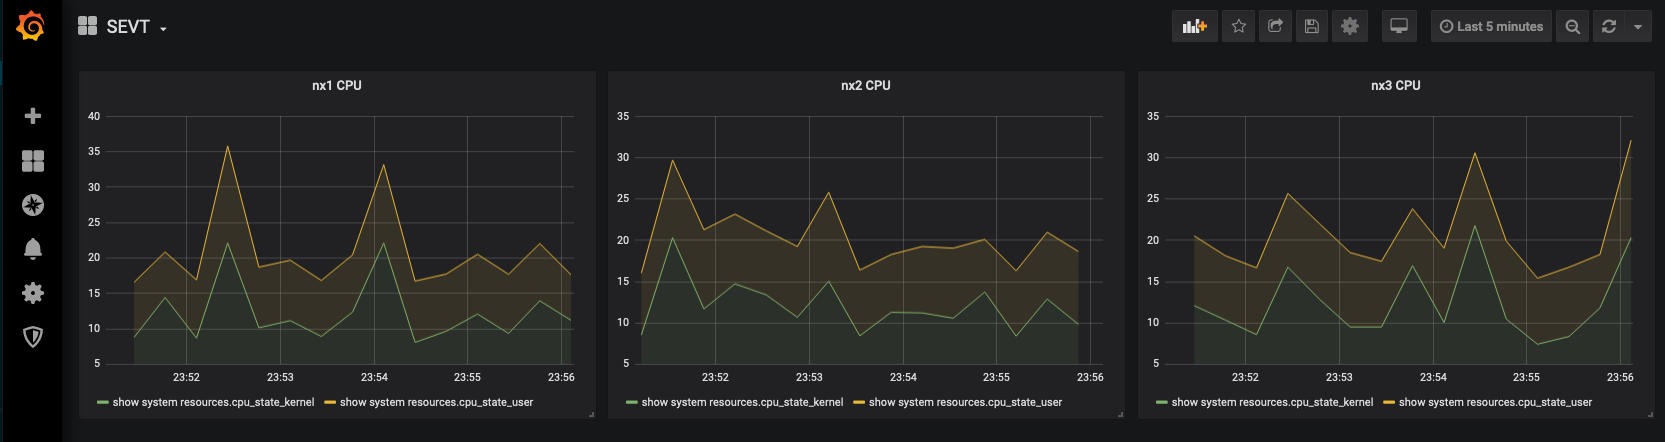
Continue to map out panels for nx2 and nx3 CPU utilization and arange the panels to the top of the Dashboard
CPU
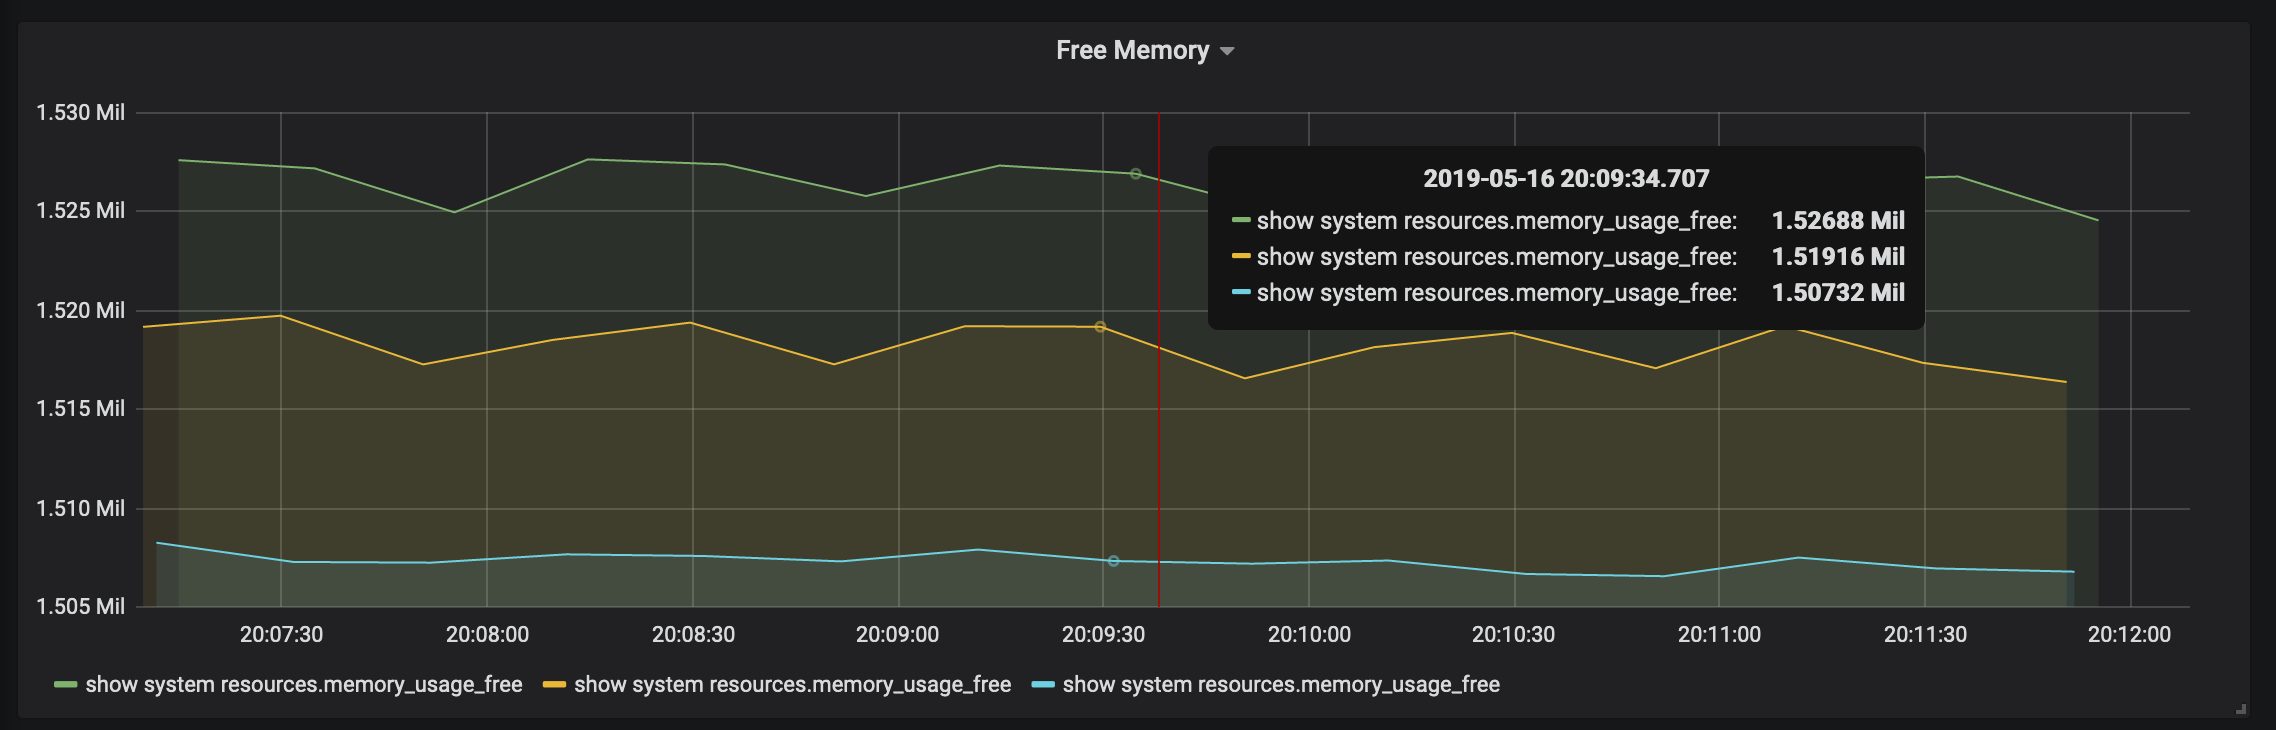
Free memory
Now lets track free memory across all three devices on one graph:
Example
When you are done it should look like this:
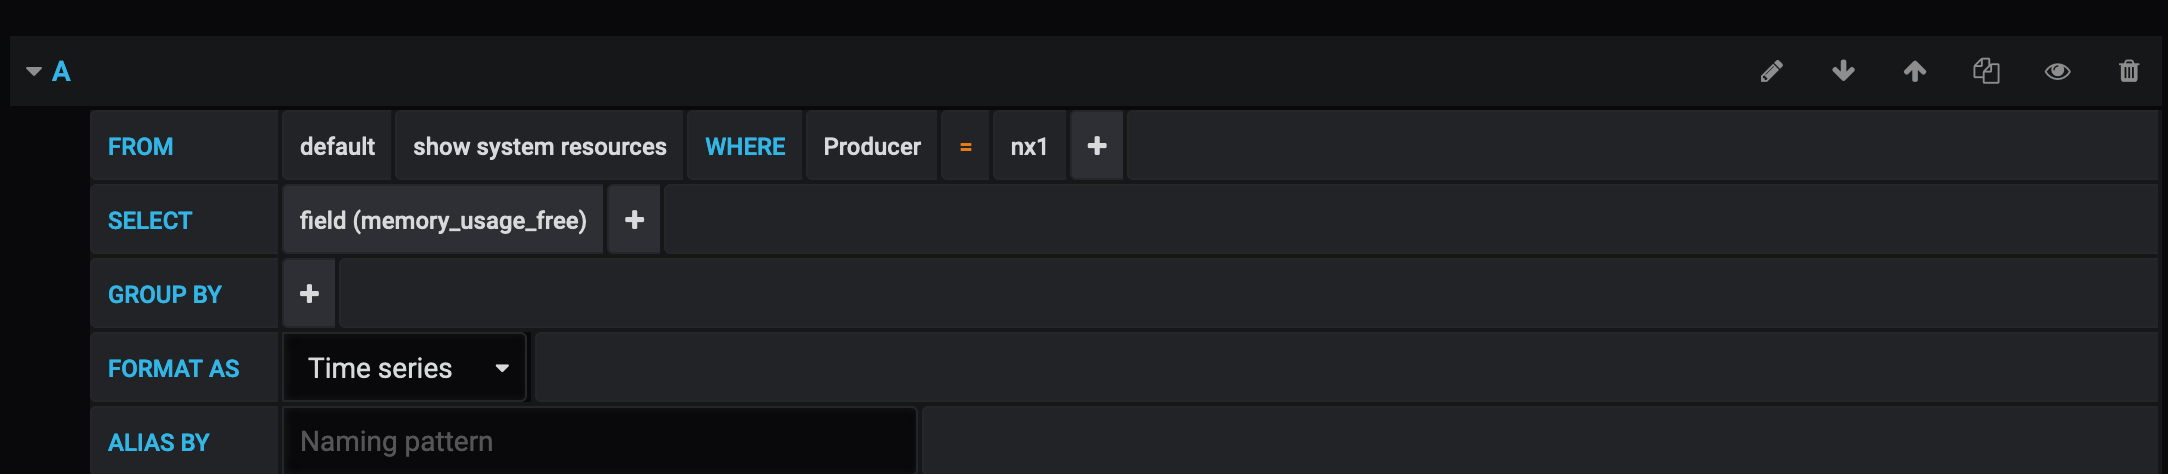
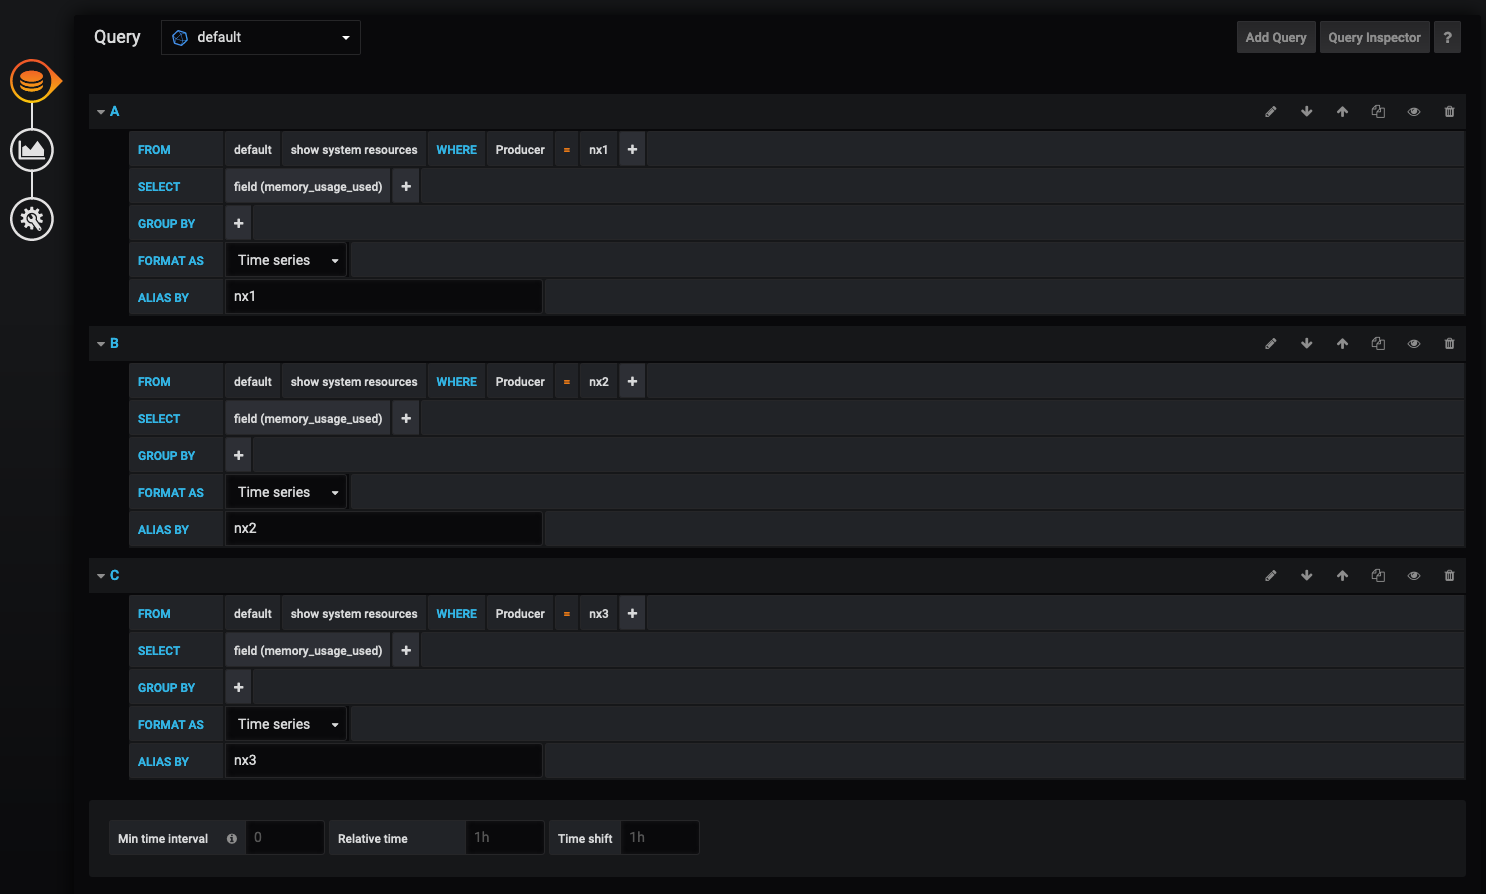
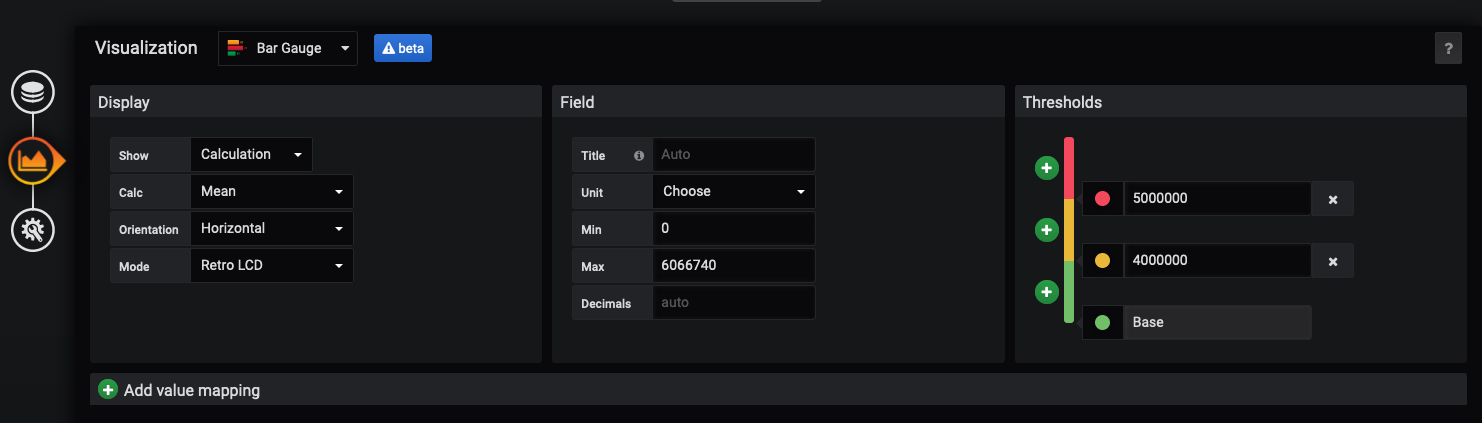
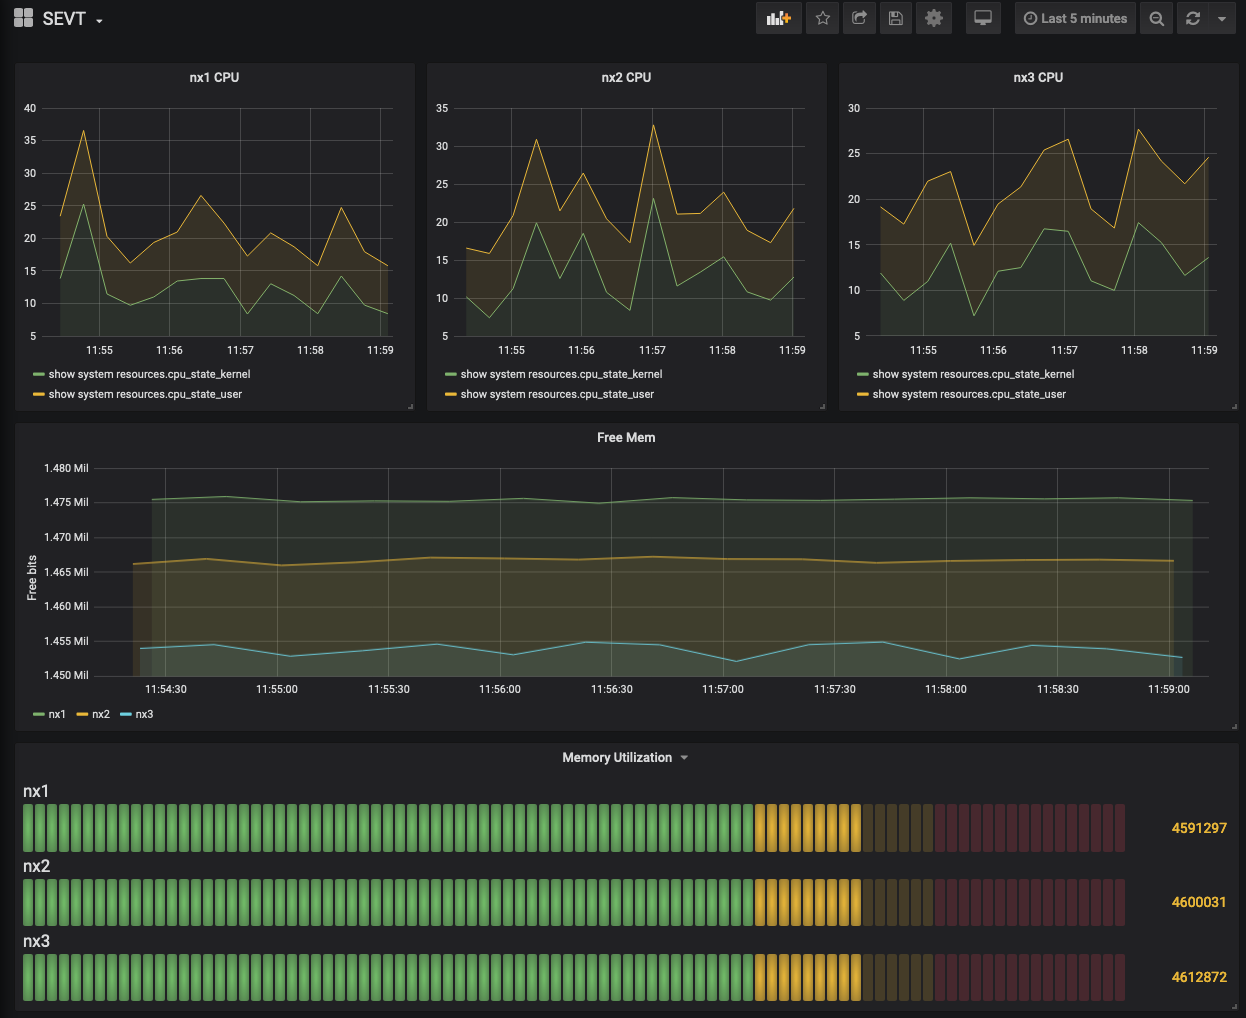
Challenge: Memory Utilization
Now that we have walked through a few different graphs, see if you can create a panel that looks like the following:
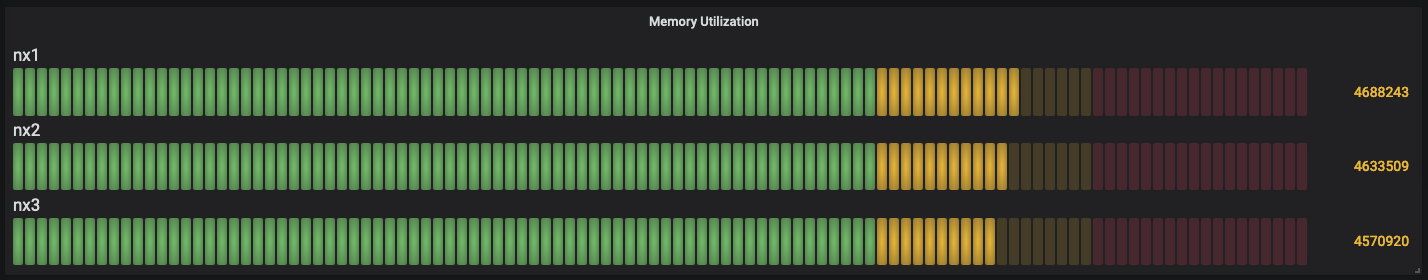
ANSWER
At this point you should have a dashboard like below:
Final Dashboard
Next steps
Feel free to continue to explore creating new or other dashboards with Grafana. More metrics were pre-parsed. You can add more sensors outlined in nxos-extra-sensors
Lab Clean Up
Once you are done lets go ahead and clean up the lab
make clan
More Labs
There are more telemetry based labs in DevnetSandbox, go check them out!